Quick way to find unused CSS with Chrome DevTools
Recently I was asked to do a front-end performance audit for an e-commerce website, specifically to find various ways to reduce the page load size. The front-end was comprised of a lot different HTML templates that mostly used a single CSS file that was more than 500kB in file size before gzip compression. It was actually even bigger before the overuse of @include was fixed in the Sass code.
To get an idea how much and which CSS could be reduced on certain pages (e.g. an item list or item detail page), I started using UnCSS and purifycss as I figured that I could easily use the output in a report. Unfortunately both tools had trouble finding the stylesheets, probably because of the invalid HTML, and when I manually specified the relevant CSS file in the command line they both couldn’t parse the CSS because it also had invalid rulesets.
As I wasn’t assigned to address these issues, I wanted to find another tool get a rough estimate how much CSS was unused. I tried the Dust-Me Selectors Firefox extension but it also struggled as the Node based tools. Luckily when I ran the Web Page Performance audit in Chrome DevTools I got exactly what I needed:
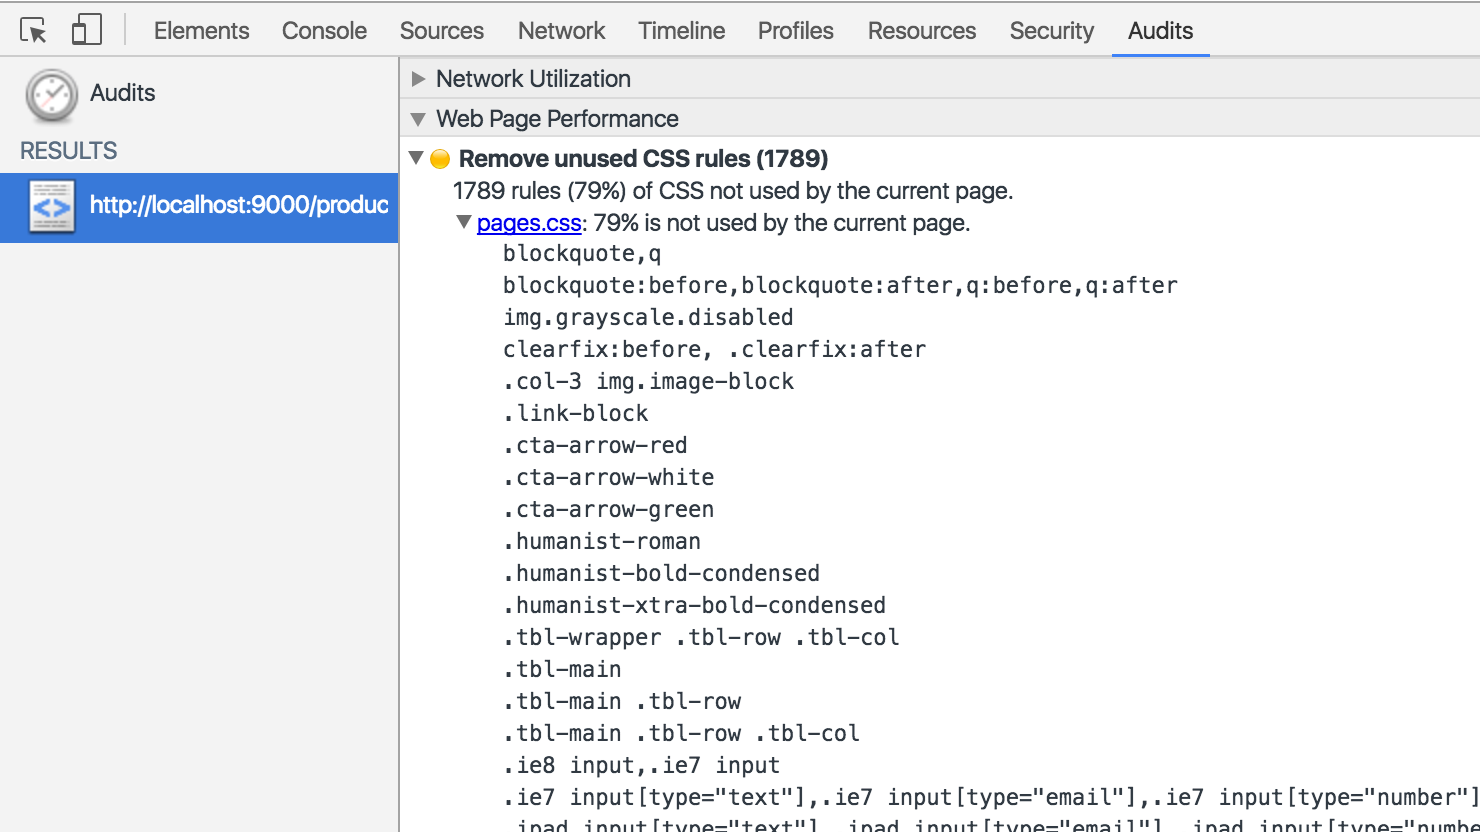
Chrome shows the percentage of unused CSS and also lists all unused rules. No need for a command line tool!
Sometimes it’s very easy to pick on browsers when you encounter a quirk or bug, but at the same time it’s amazing to see how well a browser performs in spite of all the shitty code that’s thrown at it.