Monitoring Celery performance with CloudWatch Logs Insights
If you run Celery workers on AWS infrastructure (either on EC2 or ECS Fargate), you can use CloudWatch Logs Insights to identify slow tasks and fix performance issues.
Why monitor Celery performance?
As Celery tasks are executed in the background, they are not visible to the user. This makes it difficult to identify performance issues. Slow tasks can cause several problems:
- They block worker processes from handling other tasks, reducing overall throughput.
- Long-running tasks increase the chance of timeouts or failures.
- They can delay other tasks that are time-sensitive.
- Inefficient tasks can increase infrastructure costs by requiring more compute resources.
- Long-running tasks can be problematic when you need to restart workers, for instance during deployments.
Enter CloudWatch Logs Insights
To identify which tasks are slow, you can use any application performance monitoring (APM) service that supports Celery. However, if you’re already running your workers on AWS infrastructure, CloudWatch Logs Insights provides a cost-effective alternative without requiring additional tooling.
Since your Celery worker logs are likely already being sent to CloudWatch Logs, you can analyze task execution times directly using CloudWatch Logs Insights.
Celery worker logs
First, let’s take a look at what information Celery provides in its logs. When you start a Celery worker, it will print the following banner:
 -------------- celery@ip-10-0-0-1.eu-west-1.compute.internal v5.4.0 (opalescent)
--- ***** -----
-- ******* ---- Linux-5.10.230-223.885.amzn2.x86_64-x86_64-with-glibc2.36 2025-02-05 17:01:22
- *** --- * ---
- ** ---------- [config]
- ** ---------- .> app:         your_app:0x123456789
- ** ---------- .> transport:   sqs://localhost//
- ** ---------- .> results:     disabled://
- *** --- * --- .> concurrency: 2 (prefork)
-- ******* ---- .> task events: OFF (enable -E to monitor tasks in this worker)
--- ***** -----
 -------------- [queues]
                .> celery           exchange=celery(direct) key=celery


[tasks]
  . your_app.tasks.slow_task
  . your_app.tasks.another_task
If the worker is started with --loglevel=INFO, Celery outputs these useful logs that show when tasks are received and completed:
[2025-02-10 16:49:07,774: INFO/MainProcess] Task your_app.tasks.slow_task[79b8ef7e-8885-41d7-a2c2-337c1472a7e5] received
[2025-02-10 16:49:08,778: INFO/ForkPoolWorker-1] Task your_app.tasks.slow_task[79b8ef7e-8885-41d7-a2c2-337c1472a7e5] succeeded in 1.0008730969999817s: None
That last log line is particularly useful because it shows the execution time for each task.
Analyzing task execution times with CloudWatch Logs Insights
While you could manually review these logs to find slow tasks when you have small workloads, this becomes impractical if you have a high volume of tasks. This is where CloudWatch Logs Insights comes in - it allows you to easily query and analyze your log data in CloudWatch Logs.
-
Open the CloudWatch console at https://console.aws.amazon.com/cloudwatch/ and choose Logs Insights in the navigation pane.
-
Select the log group that contains your Celery worker logs.
If you need to filter logs by a specific log stream, for instance when you have both the webserver and Celery worker log streams in the same group, you can do so by adding a filter in the query itself.
-
Select a time period that you want to query.
-
Enter the following query in the query editor:
fields @message, @logStream | filter @logStream like 'celery_worker' # Filter by log stream(s) if needed | filter @message like 'succeeded' # Only analyze finished tasks | parse @message /Task (?<task_name>[\w.]+)\[/ # Parse the task name | parse @message /in (?<seconds>[0-9]+\.[0-9]+)s/ # Parse the execution time | display task_name, seconds # Only use the parsed fields for aggregation | stats count() as call_count, # Total number of calls avg(seconds) as avg_seconds, # Average execution time min(seconds) as min_seconds, # Minimum execution time max(seconds) as max_seconds, # Maximum execution time pct(seconds, 95) as p95 # 95th percentile of execution time by task_name # Group by task name | sort call_count desc # Sort by the number of calls in descending order -
Choose Run to view the query results.
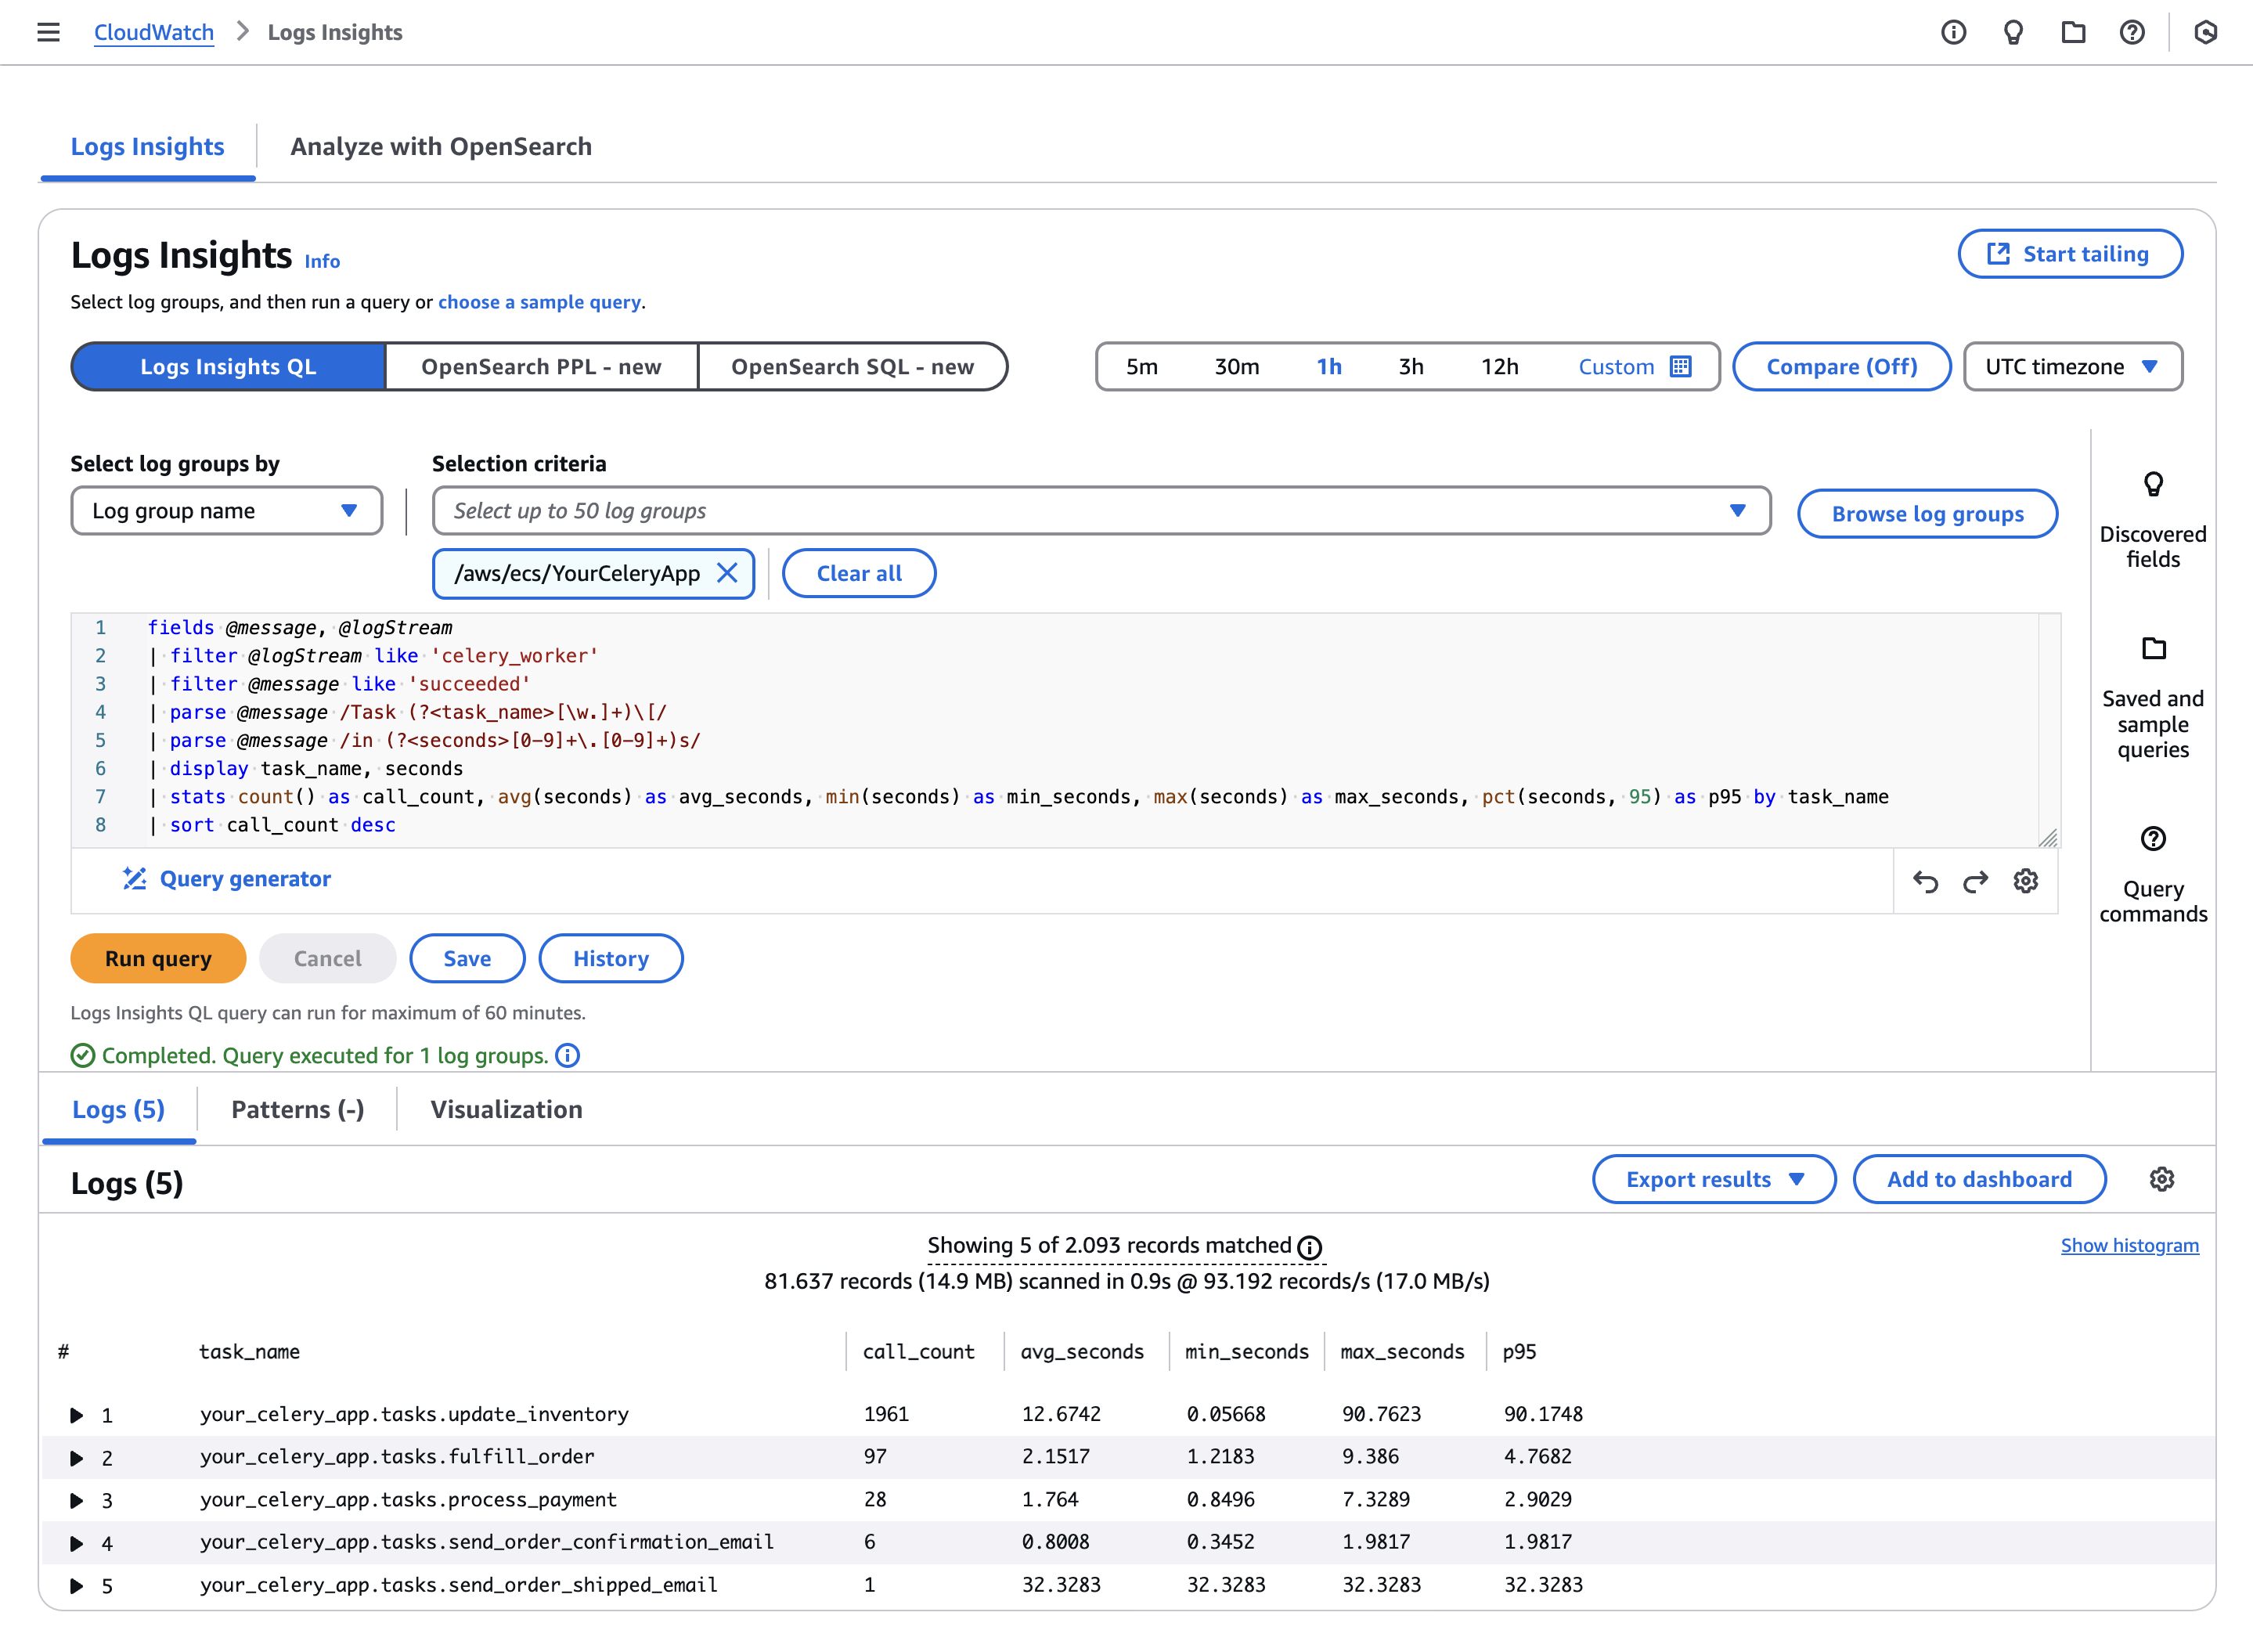
This allows you to quickly identify which tasks are frequently called and which ones are slow. Aside from the average execution time per task, the min/max and p95 are added to give you a better sense of outliers and actual performance.
You can save this query in Logs Insights to rerun it later, but you can also add it to a CloudWatch dashboard so you can monitor task performance over time.
Now that you’ve identified problematic Celery tasks in terms of performance, you can start optimizing them. By investigating which operations within these tasks are slow, you can discover targeted optimizations that will help improve the overall efficiency and reliability of your Celery workers.